(I took this code from:
https://beta.oreilly.com/learning/intro-to-svm?imm_mid=0d2dd4&cmp=em-data-na-na-newsltr_20150603
A really good tutorial on Support Vector Machines. It includes some interactive code for you to try out. Here I will just be summarizing and trying to explain what I learned from this tutorial)
Support Vector Machines is a type of supervised learning algorithm used to draw boundary lines between clusters. Say we have some training data, where there are two groups a data point can be classified in: a point can either be part of the purple team or the yellow team. We want a classifier to know when a new point belongs to the purple team or the yellow team.
A very robust way of figuring out where that distinction line between the two teams should lie is by using Support Vector Machines (SVMs). SVMs are a discriminative classifier, meaning this algorithm draws a boundary between clusters of data. Hence it is an algorithm used for regression or classification. How does this algorithm work?
A discriminative classifier attempts to draw a line between clusters. Lets look at some data:
# Here we are simply importing some of the libraries and tools we need to visualize and play with the data
import numpy as np
import matplotlib.pyplot as plt
from scipy import stats
import seaborn as sns; sns.set()
from sklearn.datasets.samples_generator import make_blobs
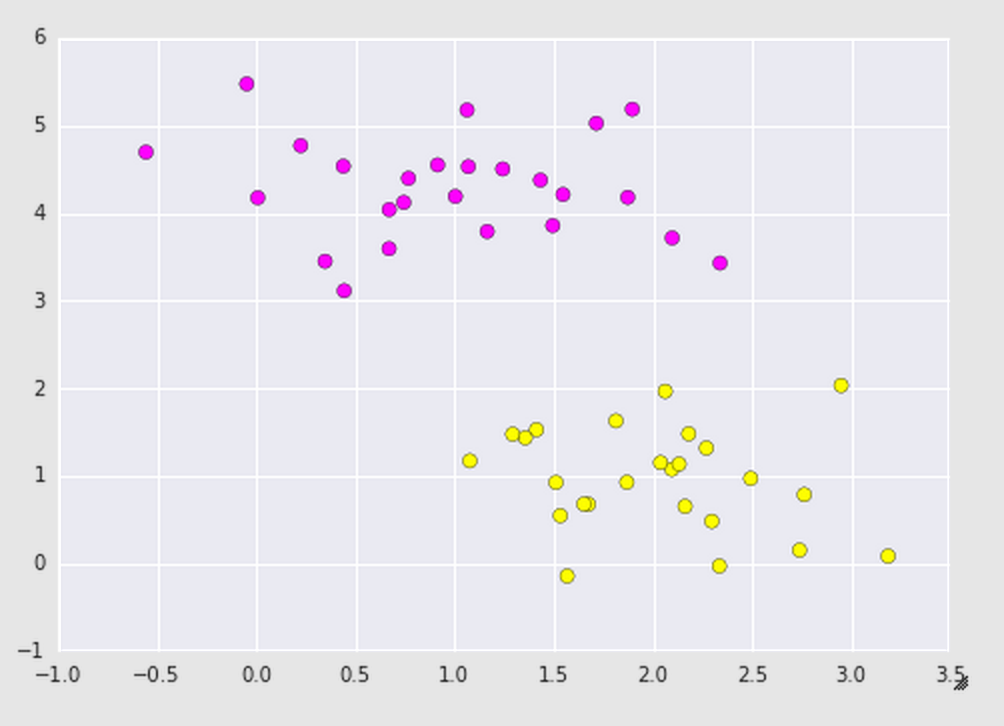
X, y = make_blobs(n_samples=50, centers=2,random_state=0, cluster_std=0.60)
plt.scatter(X[:, 0], X[:, 1], c=y, s=50, cmap='spring');
plt.show()
We looked into the sklearn library and generated a data set that made two random blobs of data (our purple and yellow teams) and then plotted them on a graph. After running this code, you should get a plot that looks like the following:
If you noticed, there is a lot of space between the purple and yellow teams, meaning there is a lot of possibilities of where we can draw the boundary line:
xfit = np.linspace(-1, 3.5)
plt.scatter(X[:, 0], X[:, 1], c=y, s=50, cmap='spring')

for m, b in [(1, 0.65), (0.5, 1.6), (-0.2, 2.9)]:
    plt.plot(xfit, m * xfit + b, '-k')

plt.xlim(-1, 3.5);
plt.show()
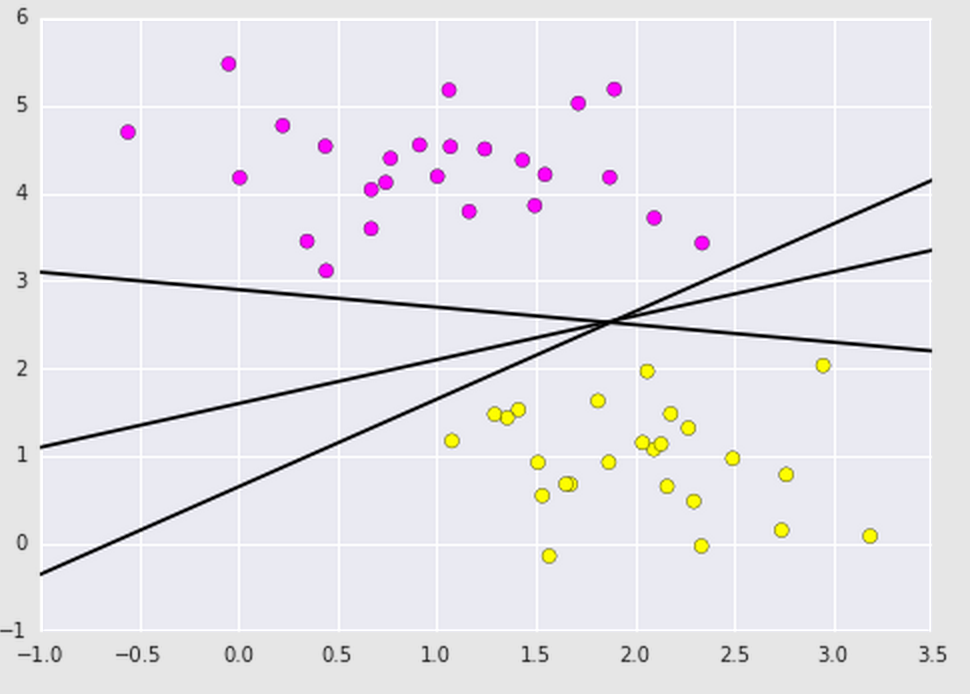
As you can see, many boundary lines can be drawn. How do we know which one is the most efficient? Here is where SVMs shine! Besides drawing a boundary line, SVMs also draw a boundary region within the datasets. It maximizes this region by using the perpendicular distance between the datasets. A Support Vector Machine Classifier can be fit to this data by using what is referred to as support vectors to draw the decision boundary lines (dotted lines that enclose the boundary region). Basically, it takes those points that are closest to the boundary of the datasets and uses them to align the main boundary line and decision boundary lines.
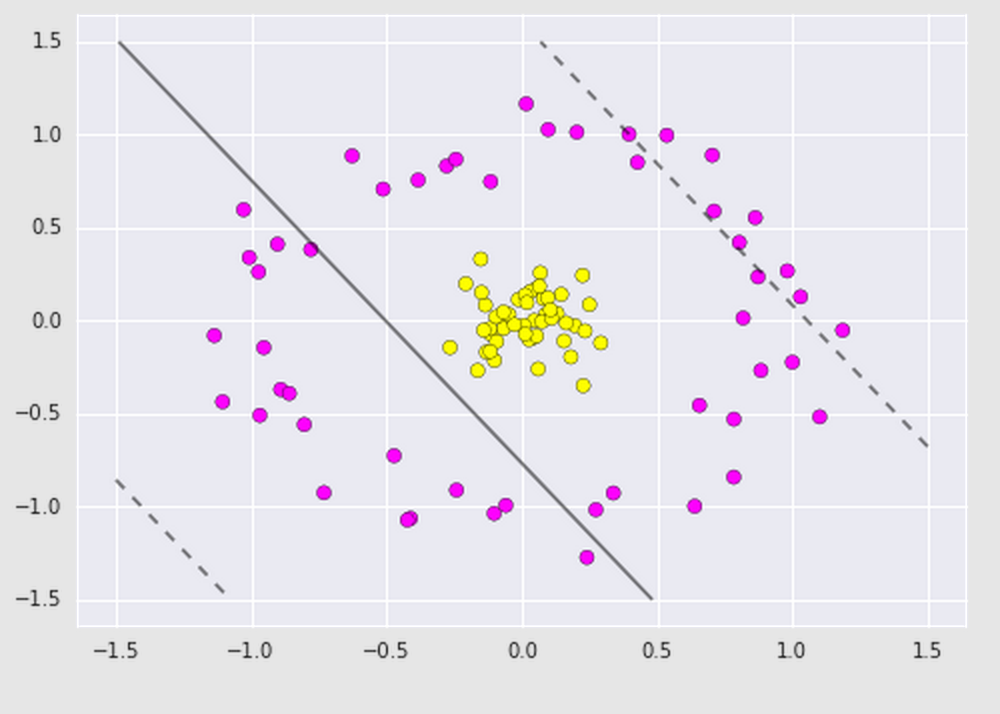
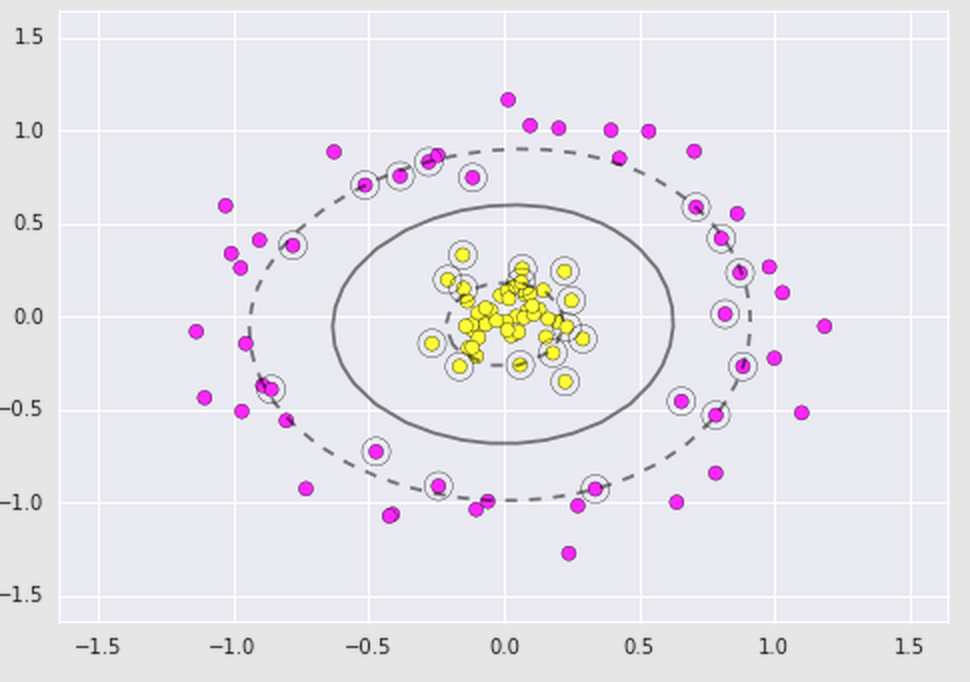
Sometimes we'll have data that isn't so linearly separable so we can step it up and apply kernels. A kernel is some functional transformation of the input data. For example, say we have the following dataset that looks like this and we apply a basic Support Vector Classifier on it. It may look like this:
|
Obviously, the boundary line is completely wrong. As we see here, the data is not linearly separable. We can apply a kernel such as the radial basis function.
We plot this along with our data and it will give us a plot that looks like this:
|
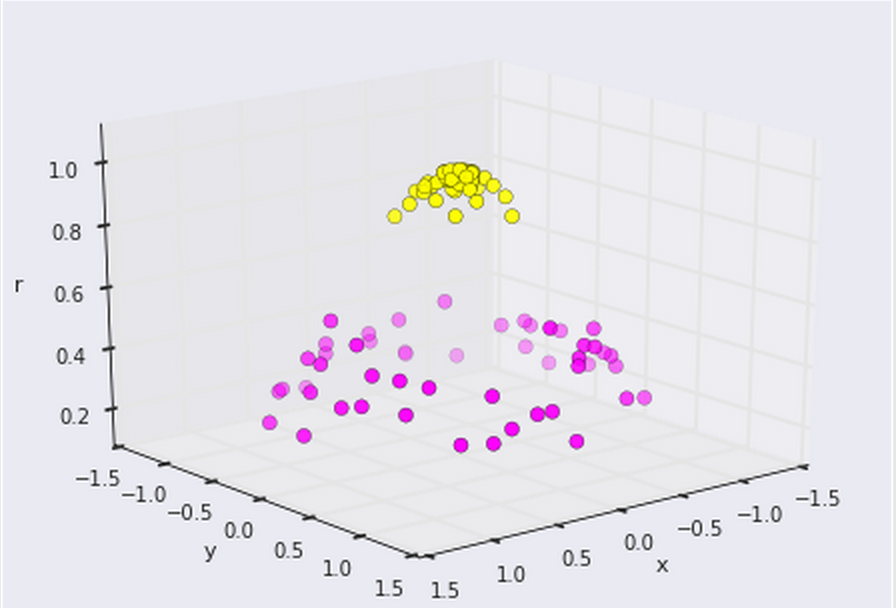
Now we can clearly see that there is a linear boundary we can make between the two groups. All thanks to a simple transformation of the original data-- the kernel!.

 RSS Feed
